

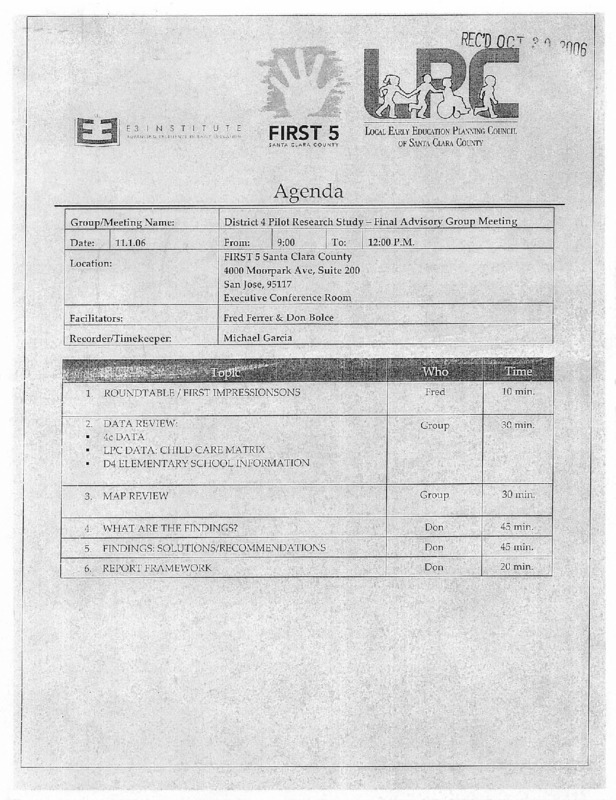
FIRST 5 Agenda, District 4 pilot Research Study, Final Advisory Group Meeting
u
E31 N S TI T UTE
FIRST 5
SANTA CLARA COUNTY
LOCAL EARLY EDUCATION PLANNING COUNC[l
OF SANTA
CuRA CouN'IY
Agenda
District 4 Pilot Research Stud - Final Adviso
Grou
9:00
To:
12:00 P.M.
From:
FIRST 5 Santa Clara County
Location:
4000 Moorpark Ave, Suite 200
San Jose, 95117
Executive
Conference Room
- . - - -,,...----::-_;__- - ~1 - - - - - - - - - - - ~ - - - - - , -~ - -=-,-,-,....,..,:'--,.,.-----=---c=...:c..:::::__c=-,,,-----""'--1
Date:
Facilitators:
Fred Ferrer & Don Bolce
Recorder/Timekee er:
Michael Garcia
1.
ROUNDTABLE/ FIRST IMI?RESSIONSONS
.
.
•
DATA REV1EW:
4cDATA
LPC DATA: CHILD CARE MATRIX
D4 ELEMENTARY SCHOOL INFORMATION
3.
MAP REVIEW
4.
Wli.ATARE THE FINDINGS?
5.
FINDINGS: SOLOTIONS/RECO
6.
REPORT FRAMEWORK
2.
Fred
10 min.
Group
30min.
30 min.
· 45min.
45 min.
District 4 Child Care Report
Provided by 4C's of Santa Clara County, Inc., Resource and Referral Department
September 2006
( 326 ) Active. Licensed Familv Child Care Homes
( I 49 ) Active. Licensed Child Care Centers
Capacity:
Ages
0 - l yrllm
2yrs Om - 5yrs 1 lm
6 years and older
Schedule:
,::,
Type of Care
Family Child
Care
Center
~·
# Vacancies
·• "
Vacancy%
# Spaces
# Vacancies
49
6%
802
137
772 1
725
9%
1369
272
20%
2241
267
12%
846
120
14%
# Spaces
804
.Centers..
-,#
,
I
.
.,
F1uil-iime
andJ>atttime
Bull-time ' Parit-time
only
only
.
71
247
F'ftmil t ,ChilcjtCarg Homes,
I
~-·
.
'
Weekend
care
·,
-
-
C
•-••..._ N
Evening care
' -•-
.
.
..
18
11
21 -
8
'
Ql:ve:m iglit
cane
......._
Vacancy%
17%
0
0
23
34
3
92
Education: 90 Centers Responded to this Survey Question (60%)/301 Family Child Care Responded (92%)
'iFypc of €are
No'Formal
Education
Less
than
High
School
Di loma
High
School
Diploma
or GED
Some
College
Cour,scs
B~ / BS
nonE€E/CD
f'amily Child
Care
2
4
50
75
0
0
1
16
Center
AA/AS
AA/AS
25
12
8
3
7
3
6
13
9
2
21
4
11
13
, EOE/CD
Other In ormation:
Type of Care
Avei;age Number of
ECE/<CD Units
Completed per;
4>11ovider;
#
Responses
15
301
(92%)
Family Child
Care
Center
41
17
239
45
19
102
(68%)
Accreditation:
Fan1ily child care homes
0 - lyrllm
2yrs Om - 5yrs 1 lm
6 years and older
# of Family,
Child €are
with 0~
EOE/OD IJnits
253
188
148
65
~Centers
165
128
105
Ff
198
184
159
137
118
C ommunity C hild C are Council of Santa Clara County, Inc.
111 East Gish Road • San Jose. CA • 95112 (408) 487-0747 (administration) · (408) 487-0762 (fax)• For child care referral information: (408) 487-0749
District 4 Elementary School Information
..
.
i
2006•Gr,owth Nl'l 'Scon
,,
p
!;-; ~· , '1
7"
~-
'
2 -n c~unbritlll
3 -1-1 C;;11nhrian
4 -17 Cambrian
5 -1•1 Campbell
6 51 Campbell
7 52 Campbdl
8 55 Campbell
10 58 Campbell
II 64 Campbell
12 65 Campbell
13 66 Campbell
14 71 Cu1lerti110
15 75 Cuper1i110
It, 1-15 Luther Burba11k
17 148 Morcla11d
18 149 Morcla11d
19 153 Morelanrl
20 155 Moreland
2 1 157 Moreland
22 158 Moreland
24 2 1-1 Union
26 222 Unklll
28 225 Union
29 226 Union
30 356 San .lt>se Llni lied
31 360 San k 1se Unified
32 367 San J,,,e Uni lied
33 373 Sttn Jl1sc linitiecJ
34 375 San .k1s~ Unified
35 381 San .ll\se Uni lied
36 387 San .fc.,se Uni lic<l
37 38~ Santa Clara
38 383 Sama Clara
39 385 Sa11tn Clam
40 389 Santa Clara
41 390 Santa Clara
42 39-1 Santa Clara
43 395 Santa Clam
44 39S Santa Clara
Frnnmatre Charles Charter
Farnham l\fartin 11. Chaner
Sartorcne Charter
L!lackfonJ
Capri
Cas.1lcnH.111t
Forest llill
Lynhavcn
Rost:mary
Sherman Oaks Comm. Charter
Village
De Vrirgas. rvlanm:I
Eisenhower. Diwgln D.
Luther Burbank
Anderson (Leroy)
Baker (Gussie M.)
Counuy Lane
Easterbrook
Latimer
Payne (George C.)
Altn Vista
Lietz
N,,ddin
Oster
Almaden
Ct>I\• (13eniaminl
Hacien,la Ma~net
Rc<·d
Schal\enbeq.!t!f
Trnce i Merrill)
77
80
79
126
98
104
110
116
100
80
35
5-1
IOI
74
60
69
77
Ill
74
65
85
805
Ill
73
50
155
ss
483
441
48-1
591
54
55
-12
569
579
45-1
486
1(,8
·11 7
5-14
514
-126
-164
506
613
-173
383
-167
474
593
-158
364
I)
(fl
82
5:!7
159
353
266
Ill
57
109
131
58
2(1
73
51
2 11
(>
103
46 402 Santa Clnrn
47 403 Santa Clam
Sutter
Washin~ton (Open)
73
6U
378
355
7-t
65
49.7'i;,
83.5%
9.8%
51
172
161
162
12·1
18 1
35.0%
39.7%
72
19.6%
168
8-11
725
662
82(1
S.l2
11.2%
645
903
9 16
841
S66
727
(,<>9
S34
86(>
837
886
749
29.4%
29.0%
11.2%
32.4%
11.7%
29.6%
864
(I
0 .0%
0
(I
8.l2
858
812
811
!'JC)
40(1
269
rv1on111gue
875
880
818
888
713
8-17
81.3%
22.2%
10.1%
2 18
-159
69
(,0
877
822
870
347
103
51
179
139
IOI
52
15-1
7(1
13·1
27-1
236
275
279
163
20 1
27
263
27(1
Sil
5~
Hu~hcs (Kathrvn)
Millikin
t).0%
115
-15.7%
~l 1.7%
Scoll Lane
60
SI
13.2%
67A%
62.4%
23.9%
11.3%
17.8%
27.7%
15.1%
4.3%
15.4%
8.6%
9.8%
379
33 1
49-1
45 40 I Santa Clara
Oriarwood
llaman (C.\V.J
72.6%;
Hl.7%
35.4%
ss
Bracher
59
'11
99
Pi..llllCl'O\'
B(lwcrs
-11
21.0%
29. 1%
2 1.7%
7$~}
10/J
250
334
353
I8
S54
243
376
38()
-11 2
354
-15()
368
399
530
Hamm(!r
I(11
128
105
/JD
676
614
-1-17
I)
11.2%
12.5%
8.7%
I I(>
38.4%
59.9%
62.4%
45.3%
-1.lY!to
(16.2%
50.8%
865
86 1
805
887
852
702
~I I
602
877
918
870
869
899
870
808
893
845
749
7.l7
7.::,~
786
783
772
78-1
732
727
726
997
73 I
769
773
817
758
71)7
74 1
712
752
This school/district has certified to the COE that during the 20U6
, STAR testing an adult irregulari ty in testing procedure occurred
88 711 0
'
• •
at the school affecting 5% or more of pupils tes1ed. Therefore,
this school does 110 1 have a valid API for 2006.
131
I9.6%
9.ll%
89
2-1
23.5%
6.8%
X23
S43
84 7
853
Distri ct 4 El ementary School Informatio n
. O/o
I
Schoor
District
E lementary School
# African % African ·
Anlcricnn Am erican
15
•II C.imb1i:rn
•M Cambrian
i
# America n American
r:rnnm:11rc ttinrl~ Ch:1m1·
fomh:un t-.fanm 11. Cha11cr
--1 7 C:,mbrian
Sa1wrrnc Chan,.:1
5 I C.uupbdl
Capri
13
:?O
Indian,
Indiaru
.,
Alask~
Nati ve
'
'.( ,
'
'ii-.~.
, ,, •
6-1 Cmnul;1..-II
Rust·1oi,r·,.
Shc11na11 Oaks Conun. Ch.111tT
Villai.:c
75 ( 11 .ertino
J .::, Lu1hcr Bui bank Lutlu:r B11rbm1k
Anderson (Lcrovl
148 Morclnnd
Llakc::r(Gussie f\.l.)
1-19 Mordand
15 3 tvlordnm.l
Easterbrook
155 Mof'eland
157 Moreland
Latimer
158 :-.fo1 ela.nJ
11:i Unicm
A lta Vistc1
Lic1z
2~5 UniN1
Noddin
1 .\56 San Jose Uniiicll Alurnden
. )67 Sau fost: Uuilic::d llacicmla 1\1at:m·t
• 37 3 San Josl· Unilic.._\ llc~d
, 375 Snn fo5c- Unili~d Schallcnbcrccr
, 3$1 Snn Jose UniOe~I Trn,.:c C~·lerin1
10
, Jtl, 7 Snn Jose UnilinJ 11:immt-r
' 38.!
S,11111' Clnrn
.\85 S:.uua Cl::ira
I ~S9 S:mrn Cb1 a
27
17
17
27
315
5.7%
0.6"o
0.0%
l.6~o
10
20
4.6!i,
7R
19
2.7%
14
10
27.9%
17
38
I)
2.7%
1.8%
14
15.1%
8.5%
6.3%
I. l ~i.
16
H
19
II
81.3",t
15
97
94
-II
15.S.''.o
<19
OY' o
1;
1-1)
103
Jf,
0.0%
l<l I
.NS
I 398
40 1
) 402
Sanla Clam
Srml,1 Clum
Saul" Clara
S:.rnta Clarn
! --10-t $:mm Clara
127
lo
Su11.:r
!total eurotlment in ~l D4 schoois= I
J .Cl"o
1.-t" ..
5_7•;c,
Washinctou 1() )('111
Totals and Avcrn~cs
0.0%
u,•·•
95
87]
!,
91
0
1 Pl
0 .0%
ti5
0.8%
3.364
13.i"a
17
3.i ,o
0
1n
301
65.6%
l.l~o
I S.0%
if]
2.6%
61
5. 1%
3.4%
13.4%
7.3%
11 .5%
175
0.9% ·
11.J"v
126
-IS
166
I ii
11.8%
16.4%
6774
6_1
33.l °lo
-1 ·1
1.no
16. 7!0
13.S~O
10.0%
990 ' . ·.• 4.8°io
20,4901
Page 1
15.3%
2 1.6%
1.2%
2.9%
3.7%
l.l)
0
2.3%
-1.9%
0.5%
1
tv\illikin
0 .0%
0 .0%
o.s~-o
11.S~i,
"26.3%
171
1.1%
0.0%
0.7%
4.4%
0.4%
3.9%
l.9~o
1.3~0
0 .2%
0.0%
1.9%
76.6~i,
.o
0.0%
16.7~0
0.0%
:!S.6%
47.J~(I
0.6%
18.3%
17.8%
I J ,ll" o
4-1
155
7R
~79
170
I 2S
0
11
.lS
1.2%
I 1.1~0
II
0
70
171
No
R espo11sc
0
Hl,
16
,0/~
·!\1ultiple/
-ll)I
91
Ill
l lami\11 tC.W.l
I ltu!h,.;s l h..athrvn)
1.1 ~0
(Nol # Multiple
Hispanic) N~ Rcsp<lns~
10.5~0
I O~<,
1-1
. Hispanic)
.29.d%
2.1~0
--1 .2':~
Uowt:rs
Islandc1
:-~
% Whitc11
I .V)
-16
15
16
13
# W11itc
# Pacific ¾ P acific I ' .
(N(!t1,,
17.6"10
13
16
2.7%
l.1" ..
Fort.-:il Hill
L\'uhan:n
,,
Alnsk~
1, # Hispanlci " ¾' Hispanic
Native fl Asian % Asia!1 II Filipino % Filipiri< 1 0 :
Latino .
Latino Islander
C :ts1IL·11h.lnt
5S (mnnbcll
-~
.,
04 PRS Elem Info 10 16 06.x1s
District 4 Elementary School Information
":
1~ .• §.cli_ool'Distr.ict:.
i
I
2
3
4
5
6
7
8
10
11
12
13
14
15
I,,
17
18
19
20
21
22
24
26
28
29
30
31
32
33
41
-1.1
44
-17
4•>
51
52
55
58
t,4
65
Ca111brian
Ca111brian
Ca111brian
Cambrian
Cam1>brll
Ca111phdl
Campbell
CamJlbdl
C:.imphl'il
Camllhell
Campbell
r,6 Campbell
7 1 Cu1><:rti11,1
75 Cu1><:11i11,1
145 Luther Burbank
148 Moreland
149 Moreland
153 Moreland
I 55 Moreland
157 Moreland
158 Moreland
2 1-1 Uni,,11
222 Uni011
225 Union
226 Union
356 San Jose Uni lied
3(,(1 San Jose Unified
367 San .lt>se Lini lied
373 San .lt>sc Li11i lied
35 38 1 San .lt•se Uni lied
36 387 San Jt>sc Linilied
37 382 Santa Clam
38 383 Santa ('Jarn
39 385 Santa Clara
40 )89 Sama Clara
4 1 390 Santa Clara
42 394 Santa Clara
43 395 Santa Clara
44 398 Santa Clara
i
o/o 0 ~ Free QI
!llcducc,lll1rlccl
,Mc~ls fElllgiblc
Students ,)
•I~
El~m·entar:)' School
'
m" . ,
13agby
Fa111111ntrc Charles Charter
Farnham Manin H. Charter
Sartoreue Chartt!r
131ackford
Capri
Castklll<'lll
Forest llill
Rost'marv
Sherman Oaks Comm. Charter
Village
lk Vargas. Manuel
Ei::enht1wer. Diwght D.
Luther Burbank
A11dcrso11 (Leroy)
13aker (Gussie M.)
Country Laue
Easterbrook
Latimer
Pavnc (Gcor~c C.)
Alta Vista
Lietz
Nmldin
Almaden
Ct•JY (lkniami111
I l.icicnda l\b.c_ntl
Reed
77
80
7CJ
126
98
483
11 0
11 6
11)0
80
569
579
5-1
1(11
7-1
60
69
77
Ill
74
65
805
Ill
7.l
155
88
69
S1.:hallenberc:cr
S2
Tra~c (Merritt)
ll
llamnh!r
Dowers
Drncher
Oriaiwood
Ha111an IC.IV.)
Iluuhes (Kathrv11)
Millikin
tv1ontagut>
Pomerov
4S 40 I Santa Clara
441
48•1
SCJI
() IJ
676
506
613
473
383
-167
•174
593
-158
364
101,
250
334
353
IS
159
7'
353
266
I ll
57
109
131
58
2(1
73
51
45
2 11
1)
(I
614
447
52.7
S54
55
44
103
30~
376
386
·1 12
354
-156
172
161
162
12-1
181
72
168
2 IS
454
486
lti8
4 17
5-14
514
426
-11
59
60
81
5S
69
60
(,5
44
54
55
42
J24
208
ss
531)
so
-159
73
60
83
378
3S5
44 1
6.9%
11.2%
12.5%
8.7%
1(19
!(i i
128
105
17.0%
21.0%
29.1%
21.7%
. t~00SI.Bapc AP] Scor<
2006 Growih l\!!,l Score
;i
874
877
822
870
2-11
41.0%
254
331
l!l.7%
13.2%
62.4%
23.9%
11.3%
17.8%
27.73/c
IS.I %
4.3%
15.4%
8.6%
9.8%
841
725
91
68.1%
115
432
347
103
51
179
139
IOI
58.0%
154
7(1
13-1
27-1
0.0%
(I
1)9
875
880
818
888
713
8-17
727
82(1
S.l2
S.15
S34
86(1
6-15
602
877
9 18
87(1
869
899
870
808
893
11.2%
81.3%
22.2%
29.8%
29.4%
29.0%
11.2%
32.4%
11.73/c
29.6%
15.8%
9 16
S41
864
865
86 1
805
887
852
7t)2
845
749
0
(1
S45
S.12
SI I
737
858
8 12
8 11
4 1. 1%
18S
IIJ9
49-1
I 1(1
236
275
279
163
201
27
263
27(1
58.61!'0
,10(1
SS.7% at the school affecting 5% or 111orc of pupils tested. Therefore,
19.6%
9.0%
29.9%
89
24
204
2.lY!,,
6.8%
-15.5•,,
9.8%
51
41.7%
35.0%
39.71!'o
38.4%
72.2%
67.6%
773
Sl7
758
71)7
7-11
7 12
752
783
78-1
732
727
726
997
731
769
T11is school/district has ccniucd to the COE that duriug the 2006
STAR testing an aduh irregularity in tcstin~ procedure occurred
this school docs not lmve a valid Al'I for 2006.
46 401 Santa Clara
47 •I03 San ta Clam
48 404 Santa Clara
IF- , ~· ..:"~
T
•~°';•
...~;;, •~
•;... '•
-~
Suiter
1Vashingto11 (Open)
Westwood
7~
32
132
~23
$43
7 19
847
85]
739
Olslricl 4 Elementary School Info rmation
I
School
District
# Arrlcan % African
Amcricnn American
Elementary School
41 C:unb1 i;m
•H Cambrian
~7 C.:-::unbrinn
49 Cunl'hdl
51
:i2
55
'.'S
C.,mpl>ell
Umobdl
Cm1mb,,.:II
Cnn1r,bcll
15
13
44
f'mnm.-ttrc Chl'lfl~ Ch.!1 lt"I'
Famh:un Martin 11. C'h:1ner
S.:111Mc:lh: Chi'.'111\."l
131nd, l1i1d
0.-4'"
46
ltO;,t"lllill'\•
Shcnnau Oaks (.\1111111. ( 'h.tm·r
tvlordnm.l
rvlordaml
Moreland
Moreland
.::22 Unic,n
225 Unif'n
Si
12.9%
144
1.2".,.
29.8%
(Not . II Multiple,
lllspanlc) No Response
167
10 )
II
6-1.9~..
Eas1erbrook
Latimer
Pa,·ne (Gc:orc.c C.1
21)
99
11.J"o
16
15
I(,
171
2? .9%
l.l
:\ltu Vi::.u1
Lic12
NC\ddiu
27
10
12
I.I
Washiucton tt.Jnen \
1~1:11
2. 7~0
IU3
17
78
19
n
38
33
0.0%
155
O.S
0
15.1%
16
8.5%
6.3~o
19
0.b'~o
0.5flo
o.so~
I l~D
0.0%
128
3.6%
47.1%
1:.,
.o
I
4.3%
6S
2.9%
3.7%
.::S.3°o
II )
5.1%
3.4%
127
60
15.0%
11.8'!0
154
2.0%
1.5%
191
16
172
19.4%
0 .-1 %
-16
5 7"' o
871
0.5~0
11 .5~0
170
JO
80
0
.2-16
3,364
15.3~0
2 1.6%
16.7~0
0.0%
e
U.2%
16.4%
61
91
I\ ..i 0
45
177
I)
301
132
14
693
3.4%
6,456
3J.5%
175
-IS
0 .7°0
1.1~0
166
0.9%
6 774
\ii
22
10.5° 0
.14
33.1%
990
20,4901
Page 1
7.3%
11.5~0
..,
126
65.6~0
0.0%
curollment in all D4 schools=
15
I)
10
II
51
Totals and A,•cruecs
I
2.0%
-L6~o
1-1
llmn11n 1C.W. 1
llud 1~ 1Knll111:-n1
Millikin
tvli1nt.1c.11c:
403 Samn Clara
i -1{}~ s~mtu Chir:i
0.0%
1.6',
1.7~0
11.1°,
Urndicr
Uri;,rwoNI
97
9-1
.J.I
0.6",
5.i~o
21)
BU\\'l•r::.
Suu..:r
I .9 ~o
12
-I I
Uaker {Gus.,;ie ti.t.)
Counlr\' Laue:
, 402 S:1111:1 Cl.ira
3.9%
3 15
_; ~ I Sno Jos~ U11ilieJ 'I rncc (t\·leritl 1
i .398 S,1111., Clnra
; 40 I Snnta Clnra
0.0%
1. 1%
0.0%
0.7%
0
0
l .t)"i;,
Lutl1l·r Burbmik
Anderson (l crov J
J:S 7 S1to Jos~ Unilit-d I l;umti l-r
Samo Clara
389 Sa111a Clara
390 S,mta Cbra
Response
0
I. 7~ 0
(1 . '"•
1(1
375 S1\ll Jose lfoi(1i:J Schallcnhcn_o..:r
382 Sm1111 Clam
383 Santa Clara
Multiple,
No
)I
Villa1:1.:
,:\56 Sau Jose l.lnilied Alma.ten
>6i San Jusc Uuilicd llacicnlla i\1.l!!IWI
1
12.<)%
II.Hispanic, % Hispanic II Pncific % Pacific
Latino
Lnt iuc lslnndcr
Islander
%
¾ White
C11tJC1li110
148 l\ torcland
14Y ~lordand
+
S3
"lo Filipino
8 1 0:'"o
7 J l:u°'--rttm,
·
,\!ask,
Native II Asian % Asian II Filipino
10.0°0
4. 1°0
Forc:st Hill
65 Camubc.:11
153
155
157
I58
Alaska
Native
I/White
(Not
llispunlc
l':11111
6,1 Cmn 1bdl
75
%
IIAnicrlcau Amcrlcnu
Indian!
Indian,
D;\ PRS Elem Info 10 16 06.xls
1.7%
16.71!0
13.8%
4.8%
Tuesday, October 24, 2006
To:
D4 Pilot Research Study Project Advisory Group
From:
D4 Pilot Core Research Team: LPC, E3 Institute, FIRST 5
Subject:
Information to Review for Upcoming November 1st Meeting
Date/Time:
Wednesday, November 1, 9:00 am-Noon
Location:
FIRST 5 Santa Clara County
sec, COE
List of attached maps:
• Santa Clara County District 4 with Cities and Freeways
• sec District 4 Boundary with Cities and Freeways
• Number of Children 0-5 in Census 2000 and Licensed and Exempt Child Care Providers
• Number of Children 0-5 in Poverty and Licensed and Exempt Providers
• Licensed Early Education Providers and Children 0-5 Years
• CEL Waiting List and Children 0-5 Years
• CEL Waiting List and Licensed and Exempt Providers
• Family Median Income and Licensed and Exempt Providers
• Family Median Income, CEL Wait List, and Licensed Providers
• Household Median Income and Licensed and Exempt Providers
• Households Receiving Public Assistance Income and Licensed and Exempt Providers
• Households Receiving Public Assistance Income and Children on CEL Waiting List by
Block Group
• Number of Children with Single Parent Working, and Licensed and Exempt Providers
• Speak English Not Well or Not at All (Ages 6-17 years)
Definitions:
Public Assistance
Total income is the sum of the amounts reported separately for wages, salary,
commissions, bonuses, or tips; self-employment income from [one's] own non-farm or
farm businesses, including proprietorships and partnerships; interest, dividends, net rental
income, royalty income, or income from estates and trusts; Social Security or Railroad
Retirement income; Supplemental Security Income (SSI); any public assistance or welfare
payments from the state or local welfare office; retirement, survivor, or disability pensions;
and any other sources of income received regularly such as Veterans' (VA) payments,
unemployment compensation, child support, or alimony.
11
11
Here is the relevant question from the survey itself, for each person in a family:
f.
Any public assistance or welfare payments from the state or local welfare office?
Yes-Annual amount ______ Dollars
0 Total children 0-5 in D4 (from census 2000)
From the spreadsheet provided to the 04 project by the county last July) the "calculated"
number is 22,837. "Calculated'' means that for those block groups that go over the District
boundary, a percentage was applied.
The "calculated" number of :,children 0-5 in poverty'' was 1695.
1 of 3
E.3 institute-Advancing Excellence in Early Education-\JVestEcl
Funclecl by FlRST S Santa Clara County
Poverty
Source: http:I/www.census.gov/hhes /www /poverty/povdef.html
Following the Office of Management and Budget's (0MB) Statistical Policy Directive 14, the
Census Bureau uses a set of money income thresholds that vary by family size and
composition to determine who is in poverty. If a family's total income is less than the
family's threshold, then that family and every individual in it is considered in poverty. The
official poverty thresholds do not vary geographically, but they are updated for inflation
using Consumer Price Index (CPI-U). The official poverty definition uses money income
before taxes and does not include capital gains or noncash benefits (such as public
housing, Medicaid, and food stamps).
Income used to compute poverty status:
•
Money income
0
Includes earnings, unemployment compensation, workers' compensation, Social Security,
Supplemental Security Income, public assistance, veterans' payments, survivor benefits,
pension or retirement income, interest, dividends, rents, royalties, income from estates,
trusts, educational assistance, alimony, child support, assistance from outside the
household, and other miscellaneous sources.
0
Noncash benefits (such as food stamps and housing subsidies) do not count.
0
Before taxes.
0
Excludes capital gains or losses.
0
If a person lives with a family, add up the income of all family members. (Non-relatives,
such as housemates, do not count.)
Measure of need (poverty thresholds):
•
•
•
•
•
•
•
Poverty thresholds are the dollar amounts used to determine poverty status
Each person or family is assigned one out of 48 possible poverty thresholds
Thresholds vary according to size
0
Size of the family
0
Ages of the members
The same thresholds are used throughout the United States (do not vary geographically)
Updated annually for inflation using the Consumer Price Index for All Urban Consumers (CPI-U) .
Although the thresholds in some sense reflect families needs,
0
They are intended for use as a statistical yardstick, not as a complete description of what
people and families need to live
0
Many government aid programs use a different poverty measure, the Department of Health
and Human Services (HHS) poverty guidelines, or multiples thereof
Poverty thresholds were originally derived in 1963-1964, using:
U.S. Department of Agriculture food budgets designed for families under economic stress
0
Data about what portion of their income families spent on food
0
Computation:
0
I
a
If total family income is less than the threshold appropriate for that family,
0
The family is in poverty
0
All family members have the same poverty status
..
o For md1v1duals who do not live with family members, their own income 1s compared with the 1
l
appropriate threshold
I
If total family income equals or is greater than the threshold, the family (or unrelated individual) is i
not in poverty
j
Example:
===============================d
2 of 3
E3 Institute-Advancing Excellence in Early Education-IN astEd
Funded by FIRST 5 Santa Clara County
•
Family A has five members: two children, their mother, father, and great-aunt.
o Their threshold was $23,108 dollars in 2004. (See poverty thresholds for 2004)
o Suppose the members' incomes in 2004 were:
!Mother:
!Father:
!Great-aunt:
!First child:
!second child:
!Total family income:11
•
•
•
•
$10,000I
s,oooj
10,000I
OI
ol
$25,000j
Compare total family income with their family's threshold.
Income / Threshold = $25,000 / $23,108 = 1.08
Since their income was greater than their threshold, Family A is not "in poverty" according to the
official definition.
The income divided by the threshold is called the Ratio of Income to Poverty.
o Family A's ratio of income to poverty was 1.08.
The difference in dollars between family income and the family's poverty threshold is called the
Income Deficit (for families in poverty) or Income Surplus (for families above poverty)
-- Family A's income surplus was $1,892 (or $25,000 - $23,108).
People whose poverty status cannot be determined:
• Unrelated individuals under age 15 (such as foster children)
o Income questions are asked of people age 15 and older
o If someone is under age 15 and not living with a family member, we do not know their
income
o Since we cannot determine their poverty status, they are excluded from the poverty
universe" (table totals)
• People in:
o Institutional group quarters (such as prisons or nursing homes)
o College dormitories
o Military barracks
o Living situations without conventional housing (and who are not in shelters)
Authority behind official poverty measure:
• The official measure of poverty was established by the Office of Management and Budget (0MB) in
Statistical Policy Directive 14.
• To be used by federal agencies in their statistical work.
• Government aid programs do not have to use the official poverty measure as eligibility criteria.
o Many government aid programs use a different poverty measure, the Department of Health
and Human Services (HHS) poverty guidelines, or variants thereof
o Each aid program may define eligibility differently
• Official poverty data come from the Current Population Survey (CPS) Annual Social and Economic
Supplement (ASEC), formerly called the Annual Demographic Supplement or simply the "March
Supplement."
History:
'The Development of the Orshansky Thresholds and Their Subsequent History as the Official U.S. Poverty
Measure," by Gordon M. Fisher
11
3 of 3
E3 lnstitute•Advancing Excellence in Early Education-vVestEd
Funded by FIRST 5 Santa Clara County
Santa Clara County District 4 with Cities and Freeway
·-<:·',>?7'
thills
othills
ock
o~k.
L~
r~
'-~
'~
sa
\..~
"
r·
Prepared by WestEd
for District 4 study.
September 25, 2006
Sources: Census 2000 TIGER files;
District: SCC GIS office
Legend
i J SCC boundary
0
4
I...._ _ ___...!Miles
8
16
c:JDistrict4
====
Freeway
N
SCC District 4 Boundary with Cities and Freeways
A
Legend
DISTRICT
c:::J 4
Milpitas
=
Santa Clara
rbank
Burbank
ruildale
I
..
- -------Prepared by WestEd
September 15, 2006
r· tos
Sources:
GIS Dept. 2006;
I
4:
Cities: Census TIGER files 2000 j
Highway 85
sec
1
0
2
4
llil••••••-===== = :::::i Miles
Freeway
Number of Children O - 5 in Census 2000
and Licensed and Exempt Child Care Providers
N
Legend
•
Exempt provider
!
Licensed Center
•
Licensed family child care home
0
rnstrict4
=
Freeway
Total Children
O
o-87
i 88 - 161
162 - 256
:___ _J: 257 - 429
1
-430 - 1034
_____J
Prepared by WestEd Oct. 24, 2006
Sources: Census 2000;
Community Care Licensing Div.
CA DSS 2006; SSA 2006 ;
PACE/APP 2006; C4C 2006;
4C Council of SCC;
Santa Clara County District 4
0
1
2
4
Miles
Number of Children O - 5 in Poverty
and Licensed and Exempt Child Care Providers
Legend
• Exempt provider
!. Licensed Center
Licensed family child care home
A
Children 0-5 in Poverty
.--~--,
' : .. <
;~~~.!
11
-
34
, . '. 35 - 69
•
! 70
-~..- •• -1
- 118
119 - 202
0rnstrict4
===== Freeway
~----
D. - - - -
Prepared by WestEd Oct. 24, 2006 ;. '
Sources: Census 2000;
Community Care_ Licensing ~iv. [-,::- . _
CA DSS 2006, SSA 2006,
. 1 >. · _....:1._1;~!J-..___....l~~~~~~:
PACE/APP 2006; C4C 2006;
4C Council of SCC;
Santa Clara County District 4
t
0
2
4
Miles
Licensed Early Education Providers
and Children O - 5 Years
N
A
Legend
..p
,.~....,a@f1==========~~~~===-v
!
\
Licensed Center
Licensed Family Child Care Home
Children O - 5
0 - 87
88 - 161
162 - 256
257 - 429
430 - 1034
DISTRICT
D4
=
_J
-A
~,!
Freeway
•
...
A
I
;-3._
,&
"'-·
r
...
!
A
.a.
! -_
,--=-;l
!
- -t::
i
-
- •-=·
i
A
l
~ --
;·
'
.A.
l
Prepared by WestEd Oct. 24, 2006
Sources: Census 2000;
Comm unity Child C~re Licer.sing
Division Vi\ Dept. oi Social Services, 2006
San ta Clara County District 4
l
04 Totc.11 Children O • 5 = 22,133 i
o.i Licensed Centers = 2d
. 04 L1censau ramiiy Cr,iid Care Hon:,,;s = ; I
!
' -
C
~-------- - ------~------~
4
2
IClliDIIIZlllllil---======::i Miles
GEL Waiting List and Children 0-5 Years
Legend
GEL waiting list
o
--·-· ..
~--------
. .. ....:::.
----- ----
2006 1
: Prepared by WestEd Oct. 24,
I
Sources: Census 2000;
Central Eligibility L.ist 2006;
l Santa Clara County District 4
i
l_ ...
~~-~':c _
hildre~_?_-
1 child
_s_:::_~~.
___L-'....r--=·,.__~-=
- :::...
r--- .,__-"_',..---_ --=
. . .'_ ------ - - - -~ - - - - - '
11111------===========:::::::i
0
1
2
4
Miles
GEL Waiting List and Licensed and Exempt Providers
N
Legend
Exempt Provider
Licensed Family Child Care Home
,;
Licensed Center
GEL# children by blockgroup
Oo- 1
=1 2 - 6
7 - 10
. 7
:~- -~ l 11 - 16
·-117 -24
DISTRICT
=
Freeway
i
Prepared by V\/estEd Oct. 22, 2006
Sources: Census 2000; SSA 2006; j
PACE/A.PP 2006; C4C 2006:
·
4C Council of sec 2006;
'
Central Eligibility Lis t 2006;
Santa Clara County District 4
To tal Children 0 - 5 = 22,837
l -- - ·-
0
4
2
.:============:::J
Miles
1m111a1_ _ _ _
Family Median Income and Licensed and Exempt Providers
N
\
"
\ .
\
Legend
',
\
Exempt provider
~·
~ - ·-~-""°'
•
•
Licensed family child care home
;
Licensed center
Family Median Income
1111 0 - 20,000
/ ,!,,
CE:]
20,001 - 40,000
' - -••
40,001 · 60,000
I
I_____·160.001 - so.ooo
r-=:~:
'-.
:_J
so.001. 100.000
I _
120,001 - 140,000
i
100,001 -120,000
140,001 - 160,000
c::J
l
160,001 - 200,001
District 4
Prepared by WestEd Oct. 24, 2006
Sources: Census 2000;
Community Care Licensing Div.
CA OSS 2006; SSA 2006;
PACE/APP 2006: C4C 2006;
4C Council of SCC;
__
ric_t_(..._
!0
~-=.::..:;;._=-- - ' - - - - - - - - -........;;----- -'-----''-----'
2
4
•---•••-=======:::::i Miles
Family Median Income, CEL Wait List, and Licensed Providers
N
Legend
Licensed family child care home
A
Licensed center
CEL waiting list
e
1 child
G
2- 3 children
0
4 - 7 children
Fami ly Median Income
:_~---=
1
-
:
r-:_---
c-:-~
40,001 - 60,000
so,001 - ao,ooo
80 ,001 - 100,000
100,001 - 120,000
120.001 - 140.000
r::.J 140,001 - 160,000
160,001 - 200,001
0
_ll
0
•'>o
~-:~:____
,
0
0
t;)·~oi;
(:';
(Y
1/~
---=~ :
JI
Av
Prepared by WestEd Oct. 24~-20; i
Sources: Census 2000;
Community Care Licensing Div.
Central Eligibility List 2006;
Santa Clara County District 4
t
.... -
~
-
-
0
2
I:!
4
llllllllll!!!llmmaalilil11::=============i Miles
Oo
o!!!
Household Median Income and Licensed and Exempt Providers
N
Legend
Exempt provider
.
Licensed family child care home
-
Licensed center
Household Median Income
C]o
1 - 20,000
_.:=; 20,001 - 40,000
I
C) 40,001 - 60,000
- - - , 60,001 - 80,000
-=-= !
I
-
.,
I
-
, ;~
\
{i,C" '
¥
V\ +
100,001 - 120,000
-
120,001 -140,000
CJ
=
•
• \ , k--r
I
-
1111 140,001 - 200,001
I •. 1....-~
I
80,001 - 100,000
District 4
Freeway
4C_ Geocoding_Result
, :_.
~ '
1..---4
- ~ -- - ----!---1-------1
.J
-·~
+• ·•
..
-
_
_,.__
''\
- - -.
#
..~ )' . .
,..,,.......
'
_)
J.___c:....- !
_+_ l --
t
I
:
/t:--
;-..--r--f7- 7 /
.:
\
\
f _,,
I
/'
\
J+
•r'·
"--
+ / /" ,-
~
I-
I A
-\
'
_ _/ ,.~4 \--; ~
:-· ·
\ i~
. . .- . . . ..
I
•
1•
../
. +
V
r
.
'
Prepared by WestEd Oct. 12, 2006
Sources: Census 2000;
Community Care Licensing Div.
CA DSS 2006; SSA 2006;
PACE/APP 2006; C4C 2006;
4C Council of sec;
Santa Clara County District 4
ljfffi
I I
1
I
,
•I
,
,
-- -...
,
__....
- - .•
tf
; - -/
2
-
t
\
Al
1
-- - ---- ~~----·--.Z!;..;:.. .I
0
-·---
1--
I
-
l
.
1
4
1,;11••-•-- c : = == ====i Miles
t
Households Receiving Public Assistance Income
and Licensed and Exempt Providers
N
Legend
.._
Licensed family child care home
Exempt provider
,:
Licensed center
Households Public Assistance
Do-a
~ ] 9- 24
' 25 - 49
50 - 91
J 92 - 151
0
=
District4
Freeway
~- /
\
. . )(' -~
~:-}--X\/2
/
\
/
~-"·<"
..,,;-~
\
/.
Prepared by WestEd Oct. 24, 2006
Sources: Census 2000;
i
Community Care Licensing Div. .
\
CA DSS 2006; SSA 2006;
!7___,£~'-..J---~----__.,,_.
PACE/APP 2006: C4C 2006;
!
/
1
4C Council of sec 2006;
r-..1
·-,~l ( ( /
-·-·~an_:
_c ~ar~-~0~_1:·_:_istr_ic_1_,r•• , .-,,;
· ·f"_,,
4
-------c:==========:: : :i
0
2
Mil%
'1
-1/
\
1
\
\
'·"-
Households Receiving Public Assistance Income
and Children on GEL Waiting List by Block Group
N
Legend
/7'. Number of households
\..V receiving public assistance
CEL Wait List Children
Oo-3
:~j 4 - 6
(j)
,-17-10
!·---·
r···-·; 11 -16
!!.\/] 17 - 24
Ornstrict4
=== Freeway
(QJ
2
4
&hilli&iE&AliiillM±Elii'lazimmec:==========:::J• r,liles
Number of Children with Single Parent Working,
and Licensed and Exempt Providers
N
Legend
Licensed Center
Licensed family child care home
Exempt Provider
Children with single parent, working
LJ0 - 9
7
--,
10 - 27
28 - 51
52- 93
94 - 177
DISTRICT
CJ4
=
Freeway
,,.
--r -
Prepared by WestEd Oct. 24, 2006
Sources: Census 2000;
(
(
Comrri;,i~s~~go~~~s~c;~itg Div.:
L~
PACE/APP 2006; C4C 2006·
C4 Council of sec
-~~::__c1~:,~- ~ounty District 4
1
1
_,,,,-,....
2
4
__
r-----
S eak En lish Not Well or Not at All A es 6-17
Legend
DISTRICT
._ISl]J 4
=
Freeway
Languag e not English
0 -11 persons
12 - 35 persons
;~=~J 36 - 71 persons
~____; 72 • 114 persons
c::::J
\
17-,-,·
L
r;
\L
_'h _
_;'"i=·.~=a=::.'i~a:m----J
Prepared by VVestEd Oct. 24, 2006
Sources: Census 2000
: Map shows number of persons aged 6 - 17
' within census block groups who "speak
English not well" or "speak English not
at all."
0
i
2
4
-•------========::i Miies
115 - 184 persons
Document
Agenda and attachments including reports and census maps. September 6 report of Active Licensed Family Child Care Homes and Centers; District 4 Elementary School Information; District 4 Pilot Research Study Project Advisory Group report; Various Census Tract Maps
Collection
James T. Beall, Jr.
Content Type
Agenda
Resource Type
Document
Date
11/01/2006
District
District 4
Creator
FIRST 5 of Santa Clara County
Language
English
City
San Jose
Campbell
Santa Clara
Rights
No Copyright: http://rightsstatements.org/vocab/NoC-US/1.0/